No Wonder So Many People are Depressed
Moderator: bbmods
Addendum:
After I wrote the post above, Thomas Piketty's name and book, Capital in the Twenty-First Century, came to mind as possibly relevant to this discussion. I hope that someone here has read it; I merely spotted it on the coffee table of a friend (a presumed capitalist, but maybe it was his wife's) I was visiting a few years ago.
Piketty's figures and tables from the book are at the following link:
http://piketty.pse.ens.fr/files/capital ... sLinks.pdf
(There are many of them, although they are probably mainly focused on inequality, so anyone who thinks inequality does not matter might not find them interesting.)
A long review of the book by Paul Krugman:
http://www.nybooks.com/articles/2014/05 ... ilded-age/
Back to homicide graphs... On the previous page, I showed
Pinker's homicides graph (2015) ( http://magpies.net/nick/bb/viewtopic.ph ... 30#1839230 )
and asked
Question:
If you were forced to guess what the light blue US line looks like as you extend it backwards from 1967 for a few years, what line would you draw??
Answer:
[Note: if you are like me, you will need to be logged in to view this graph. I'll also have to continue the commentary after the post break.]
Asher's homicides graph:
You do not have the required permissions to view the files attached to this post.
As you can see above, Asher's graph starts from 1960, and if you guessed that the homicide rate around 1960-67 was relatively low, you guessed correctly.
But wait... There's more...
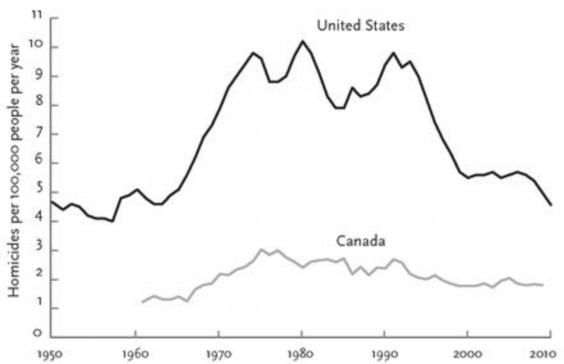
Pinker's homicides graph, US & Canada (2011):

Apparently, in Pinker's 2011 book there is the graph above, which starts from 1950. It looks like in the 50s, those Americans were also relatively non-homicidal. Oh, and those Canadians haven't exactly got less homicidal over time.
But wait again... There's more again...
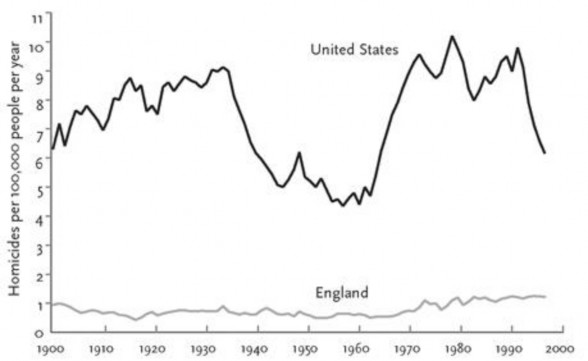
Pinker's homicides graph, US & England (2011):

Apparently, in Pinker's 2011 book there is also the graph above, which starts from 1900. It looks like England's homicide rate over the century doesn't really budge. The US's homicide rate over the century goes up and down and up and down...
Question:
Why does the updated graph start from 1967 and not, for example, 1960 or 1950 or 1900?
[To be continued...]
But wait... There's more...
Pinker's homicides graph, US & Canada (2011):

Apparently, in Pinker's 2011 book there is the graph above, which starts from 1950. It looks like in the 50s, those Americans were also relatively non-homicidal. Oh, and those Canadians haven't exactly got less homicidal over time.
But wait again... There's more again...
Pinker's homicides graph, US & England (2011):

Apparently, in Pinker's 2011 book there is also the graph above, which starts from 1900. It looks like England's homicide rate over the century doesn't really budge. The US's homicide rate over the century goes up and down and up and down...
Question:
Why does the updated graph start from 1967 and not, for example, 1960 or 1950 or 1900?
[To be continued...]
- Mugwump
- Posts: 8787
- Joined: Sat Jul 28, 2007 9:17 pm
- Location: Between London and Melbourne
The real point is that trauma management and medical technology should cause homicides to fall very dramatically across decades, yet in both the US and UK, the rate is more or less the same as it was in 1900.
Secondly, between the 1960s and 1970s the rate nearly doubled in both the Uk and the US. Welcome to the silent holocaust of the social and sexual revolution.
Secondly, between the 1960s and 1970s the rate nearly doubled in both the Uk and the US. Welcome to the silent holocaust of the social and sexual revolution.
Two more flags before I die!
Yes, the issue of improved medical capabilities is an important one, but I haven't seen any concrete stats on how that has affected survival rates in the course of the 20th century.
According to Eisner, Monkkonen "proposed to use information about the elapsed time from injury to death as a rough indicator of the potential impact of modern medical technology. He argues that most deaths occurring within the first one to two hours after the injury are probably not preventable even with modern medicine, while the vast majority of those occurring after twenty-four hours could be prevented by modern technology".
I see no indication of how accurate this proposal is.
[Regarding earlier times, Eisner notes: "Most authors agree, however, that changes in medical technology are unlikely to have had any major impact on the chances of surviving a wounding before the late nineteenth century."]
Homicide graph starting year: [ctd.]
I guess the first question is whether the impression the graphs above give is different because of the different starting points.
For me, the graph starting at 1967 never looked like a downward trend over the whole time period shown. The Asher graph going back to 1960 therefore didn't change too much, just confirming what the eye guessed.
Then we have the graphs starting at 1950 and 1900... I don't know how someone looking at the 1900-2000 graph can think the US homicide data show a long-term downward trend. It just reinforces the feeling that it's reasonable to expect smaller wiggles on smaller time scales and large wiggles on large time scales (e.g. half a century).
- Mugwump
- Posts: 8787
- Joined: Sat Jul 28, 2007 9:17 pm
- Location: Between London and Melbourne
Some things cannot be readily quantified, and this seems at the tougher end of the spectrum, but a well-researched article in the impeccably respectable British Medical Journal in 2002 concluded that "murder rates would be up to five times higher than they are, but for medical advances in the last 40 years."K wrote:Yes, the issue of improved medical capabilities is an important one, but I haven't seen any concrete stats on how that has affected survival rates in the course of the 20th century.
According to Eisner, Monkkonen "proposed to use information about the elapsed time from injury to death as a rough indicator of the potential impact of modern medical technology. He argues that most deaths occurring within the first one to two hours after the injury are probably not preventable even with modern medicine, while the vast majority of those occurring after twenty-four hours could be prevented by modern technology".
I see no indication of how accurate this proposal is.
https://www.ncbi.nlm.nih.gov/pmc/articles/PMC1124155/
Given that murder rates represent the tip of the iceberg of violent crime, this is good evidence of the silent holocaust of revolutionary liberalism. Imagine if the twitter police, rather than sniffing the air for counter-revolution, had the capacity to think about evil, and its source and restraints. Their mob mind would explode.
Two more flags before I die!
The article above by Dobson in BMJ reports on work of Harris et al. in Homicide Studies. [Good find, Mugwump!]
Key quote:
""Our lethality findings are strongly consistent with the hypothesis that progress in emergency medical care has converted an ever increasing proportion of homicides into non-lethal assaults and thus, by virtue of good intentions, ironically and unintentionally masked a continuing epidemic of violence in America."
Key graph:
[again, you probably need to be logged in to see this]
You do not have the required permissions to view the files attached to this post.
By way of the Center for American Progress
( https://www.americanprogress.org/issues ... ent-crime/ ):

Comments:
# Yes, there are peaks (as David alluded to).
# Yes, even with a recession from the peak, the aggravated assault rate in 2010 was almost three times what it was in 1960.
# The graph seems to support the Harris et al. linking of murder and aggravated assault (the former in some sense being regarded as a fraction of the latter, with that fraction influenced by trauma medicine expertise). You can see that the two curves are quite similar in shape, with the homicide line just shallower (though you could say the same thing of the rape curve).
( https://www.americanprogress.org/issues ... ent-crime/ ):

Comments:
# Yes, there are peaks (as David alluded to).
# Yes, even with a recession from the peak, the aggravated assault rate in 2010 was almost three times what it was in 1960.
# The graph seems to support the Harris et al. linking of murder and aggravated assault (the former in some sense being regarded as a fraction of the latter, with that fraction influenced by trauma medicine expertise). You can see that the two curves are quite similar in shape, with the homicide line just shallower (though you could say the same thing of the rape curve).
